Gross Domestic Product and its Growth: an Introduction Notes 10th Social Science
Gross Domestic Product and its Growth: an Introduction Notes 10th Social Science
10th Social Science Lesson 10 Notes in English
10. Gross Domestic Product and its Growth: an Introduction
The GDP is the market value of all the final goods and services produced in the country during a time period. Every part of the definition is important.
Goods and services: as you know by now, goods are tangible items while services are activities which are intangible.
Market value:
- This is the price at which goods and services are sold in the market. The GDP measures all the goods and services produced in the country.
- For this, we have to add all the goods and services produced. However a nation produces a wide range of goods like rice, shoes, trains, milk, clocks, books and bicycles.
- If only the quantities are taken into account, there is no meaningful way to add these up. For example, how do you add 1000 litres of milk with 500 clocks?! Likewise there is no meaningful way to add the quantities of services since a wide range of services are produced, such as the work done by doctors, police, fire brigade, teachers, bus drivers and district collectors.
- When we cannot add the quantity of one type of good with another type of good or one type of service with another type of service, certainly there is no sensible way to add the quantities of goods produced with those of services produced! How would we add the quantity of milk produced in the country with the service produced by teachers?!
- The GDP solves this problem by measuring the goods and services in the currency of the country, which is the rupee in the case of India.
- The rupee values are derived from the prices at which the goods and services are sold in the market.
- Only those goods and services with a market value are included in the GDP. This implies that unless a good or service is sold in the market, it is not included in the GDP.
- For example if you pay ` 50 to get a manuscript typed in a computer centre, the service is included in the GDP since it is sold in the market.
- If you type the manuscript yourself, the service typing a manuscript is not included in the GDP since you did not purchase it for a price in the market. Final goods and services: Economists Tyler Cowen and Alex Tabarrok say that “final goods and services” are the goods and services which will be used or consumed and will not form a part of other goods and services. The goods and services which will be used for producing other goods and services and will form a part of the goods and services produced are called “intermediate goods”.
- Only the final goods are included in the GDP. Intermediate goods are not counted in calculating the GDP because their value is included in the final goods.
- So if the intermediate goods are included in the GDP it will result in what is called “double counting”. For example, a cup of tea bought in a hotel is a final good because it is consumed and does not form a part of producing something else.
- So the market value of the cup of tea, being a final good, is included in the GDP. Sugar which is mixed in the tea is an intermediate good because it is used in making tea and forms a part of the tea served.
- Suppose the tea is priced ` 10 a cup, of which the value of sugar used is ` 2. So the price of the cup of tea includes the ` 2 price of the spoon of sugar. If this value of sugar is included in the GDP, it will be counted twice: as a spoon of sugar and again as a part of the cup of tea. This is “double counting” and to avoid it the intermediate goods like sugar are excluded from GDP.
- Should the market value of utensils used to brew the tea be included in the GDP? You may argue that since the utensils are bought not as final goods but to produce tea, they are intermediate goods and so they should not be included in the GDP.
- However the utensils, unlike sugar, do not form a part of the final good, the cup of tea. For this reason they should be included in the GDP.
10th Social Book Back Questions
National Income
- ‘National Income is a measure of the total value of goods and services produced by an economy over a period of time, normally a year’.
- Commonly National Income is called as Gross National Product (GNP) or National Dividend.
Various terms associated with measuring of National Income
Gross National Product (GNP)
Gross National Product is the total value of (goods and services) produced and income received in a year by domestic residents of a country. It includes profits earned from capital invested abroad.
GNP = C + I + G + (X–M) + NFIA)
C = Consumption I = Investment G = Government Expenditure X-M = Export – Import NFIA = Net Factor Income from Abroad)
Gross Domestic Product (GDP)
Gross Domestic Product (GDP) is the total value of output of goods and services produced by the factors of production within the geographical boundaries of the country.
Net National Product (NNP)
Net National Product (NNP) is arrived by making some adjustment with regard to depreciation that is we arrive the Net National Product (NNP) by deducting the value of depreciation from Gross National Product. (NNP = GNP − Depreciation)
Net Domestic Product (NDP)
Net Domestic Product (NDP) is a part of Gross Domestic Product, Net Domestic Product is obtained from the Gross Domestic Product by deducting the Quantum of tear and wear expenses (depreciation) NDP = GDP − Depreciation
Per Capita Income (PCI)
Per capita Income or output per person is an indicator to show the living standard of people in a country. It is obtained by dividing the National Income by the population of a country.
Per capita Income = National Income / Population
Personal Income (PI)
Personal income is the total money income received by individuals and households of a country from all possible sources before direct taxes, therefore, personal income can be expressed as follows (PI = NI corporate Income Taxes − Undistributed corporate profits − social security contribution + Transfer payment).
Disposable Income (DI)
Disposable income means actual income which can be spent on consumption by individuals and families, thus, it can be expressed as DPI = PI − Direct Taxes (From consumption approach DI = Consumption Expenditures + Savings)
Gross Domestic Product (GDP)
Produced in the country:
- GDP of India includes only the market value of goods and services produced in India.
- For example the market value of apples produced in Kashmir are included in our GDP since Kashmir is in India.
- The market value of apples produced in California, even if they are sold in Indian markets, are not included in our GDP because California is in the U.S.
Produced during a time period:
- The GDP of a country measures the market value of goods and services produced only during the specified time period.
- The goods and services produced in earlier periods are not included. If an year is the specified time period, the GDP of 2018 will include the market value of goods and services produced only during 2018.
- So a bicycle produced in 2017 will not be included in the GDP measure for 2018. In India the GDP is measured both annually and quarterly.
- The annual GDP is for a financial year which is from April1 of say 2017 to March 31, 2018. This is written as 2017-18.
- The quarterly GDP estimates are for each of the four quarters into which India’s financial year is divided: First quarter, denoted Q1: April, May and June Second quarter, or Q2: July, August, September Third Quarter or Q3: October, November, December Fourth Quarter, or Q4: January, February, March.
- The annual GDP for financial year 2017 – 18 will include only the goods and services produced during this financial year and will exclude the goods and services produced in the previous years.
- Likewise GDP for Q2 will include only the goods and services produced in Q2 and will not include the goods and services produced in Q1.
Gross Domestic Product (GDP) definition
- Gross Domestic Product (GDP) represents the economic health of a country.
- It represents a sum of a country’s production which consists of all purchases of goods and services used by individuals, firms, foreigners and the governing bodies.
- The monetary value of all the finished goods and services produced within a country’s border in a specific time period.
GDP = C + I + G + (X − M)
C = Consumption I = Investment G = Government Expenditure ( X − M) = X = Exports − M = Imports
Methods of GDP Calculating
Expenditure Approach:
- In this method, the GDP is measured by adding the expenditure on all the final goods and services produced in the country during a specified period.
- The different types of expenditure are shown in this equation: Y = C + I + G + (X − M)
The Income Approach:
This method looks at GDP from the perspective of the earnings of the men and women who are involved in producing the goods and services. The income approach to measuring GDP (Y) is
Y = wages + rent + interest + profit
Value-Added Approach:
- A cup of tea served to you in a hotel is a “final good”. The goods used to produce it, tea powder, milk, and sugar, are “intermediate goods” since they form a part of the final good, the cup of tea.
- One way to measure the market value of the cup of tea is to add the value produced by each intermediate good used to produce it. Each intermediate good, the tea powder, milk and sugar, adds value to the final output, the cup of tea.
- In the value-added approach the value added by each intermediate good is summed to estimate the value of the final good.
- The sum of the value added by all the intermediate goods used in production gives us the total value of the final goods produced in the economy.
Importance of GDP
1. Study of Economic Growth.
2. Unequal distribution of wealth.
3. Problems of inflation and deflation.
4. Comparison with developed countries of the world. 5. Estimate the purchasing power.
6. Public Sector.
7. Guide to economic planning.
Limitations of GDP
The GDP is the most widely used measure of the state of the economy. While appreciating its usefulness, we should be aware of some of its limitations.
Several important goods and services are left out of the GDP:
- The GDP includes only the goods and services sold in the market.
- The services provided by parents to their children is very important but it is not included in the GDP because it is not sold in the market.
- Likewise clean air, which is vital for a healthy life, has no market value and is left out of the GDP.
GDP measures only quantity but not quality:
- In the 1970s schools and banks did not permit the use of ballpoint pens. This is because the ones available in India were of very poor quality.
- Since then, not only has there been a substantial increase in the quantity of ballpoint pens produced in India but their quality has also improved a lot.
- The improvement in quality of goods is very important but it is not captured by the GDP.
GDP does not tell us about the way income is distributed in the country:
The GDP of a country may be growing rapidly but income may be distributed so unequally that only a small percentage of people may be benefitting from it.
The GDP does not tell us about the kind of life people are living:
A high level of per capita real GDP can go hand-in-hand with very low health condition of people, an undemocratic political system, high pollution and high suicide rate.
Composition of Gross Domestic Product (GDP)
Indian economy is broadly divided into three sectors which contribute to the GDP namely Agriculture and allied activity, Industry and Services.
Primary Sector: (Agricultural Sector)
- Agricultural sector is known as primary sector, in which agricultural operations are undertake.
- Agriculture based allied activities, production of raw materials such as cattle farm, fishing, mining, forestry, corn, coal etc. are also undertaken.
Secondary Sector: (Industrial Sector)
- Industrial sector is secondary sectors in which the goods and commodities are produced by transforming the raw materials.
- Important industries are Iron and Steel industry, cotton textile, Jute, Sugar, Cement, Paper, Petrochemical, automobile and other small scale industries.
Tertiary: (Service Sector)
- Tertiary sector is known as service sector it includes Government, scientific research, transport communication, trade, postal and telegraph, Banking, Education, Entertainment, Healthcare and Information Technology etc.
- In the 20th century, economists began to suggest that, traditional tertiary services could be further distinguished from “quaternary” and “quinary” service sectors.
Contribution of different sectors in GDP of India
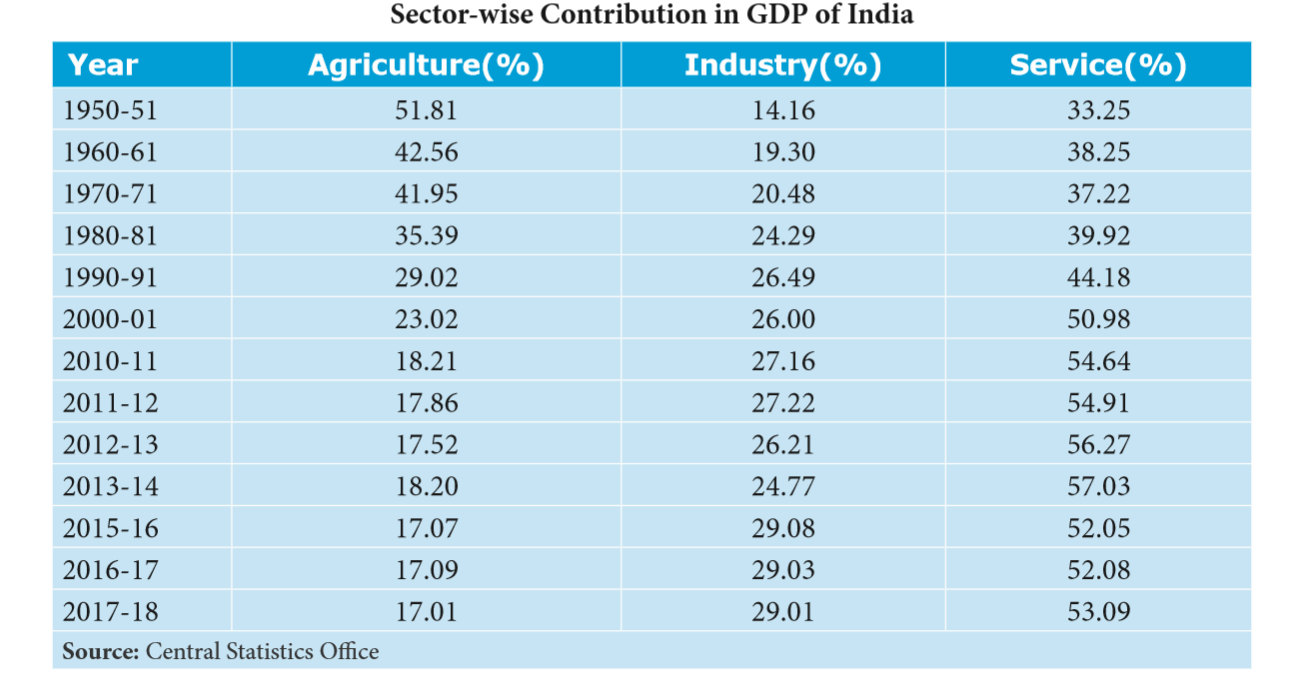
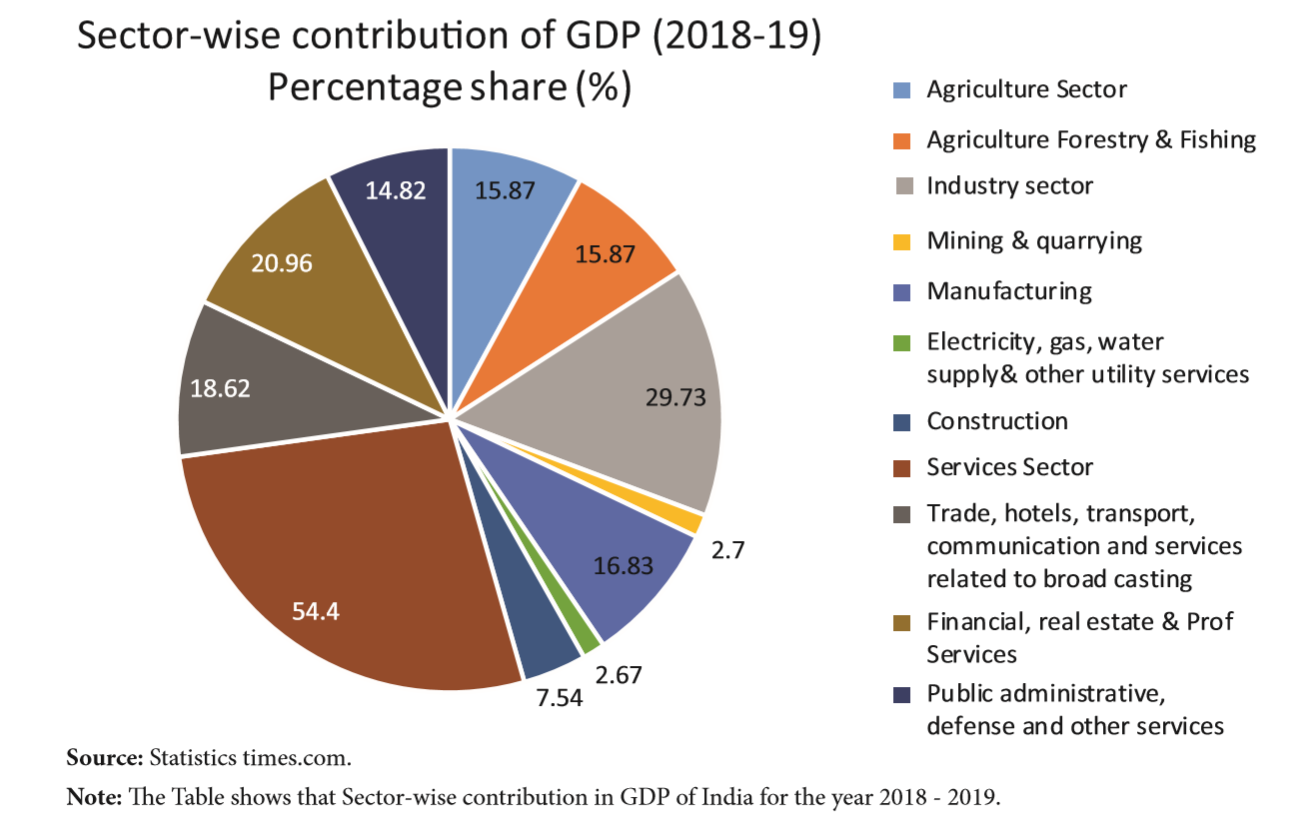
- Services sector is the largest sector of India. Gross Value Added (GVA) at current prices for Services sector is estimated at 92.26 lakh crore in 2018-19.
- Services sector accounts for 54.40% of total India’s GVA of 169.61 lakh crore Indian rupees. With GVA of ` 50.43 lakh crore, Industry sector contributes 29.73%.
- While, Agriculture and allied sector shares 15.87%.India is 2nd larger producer of agriculture product.
- India accounts for 7.39 percent of total global agricultural output.
- In Industrial sector, India world rank is 6 and in Service sector, India world rank is 8. Contribution of Agriculture sector in Indian economy is much higher than world’s average (6.4%).
- Contribution of Industry and Services sector is lower than world’s average 30% for Industry sector and 63% for Services sector.
Economic Growth and Development
- As per the economist Amartya Sen, economic growth is one aspect of economic development. Also, united nation see it like this “Economic development focuses not only on man’s materialistic need but it focuses on overall development or rise in its living standards.
Economic Growth
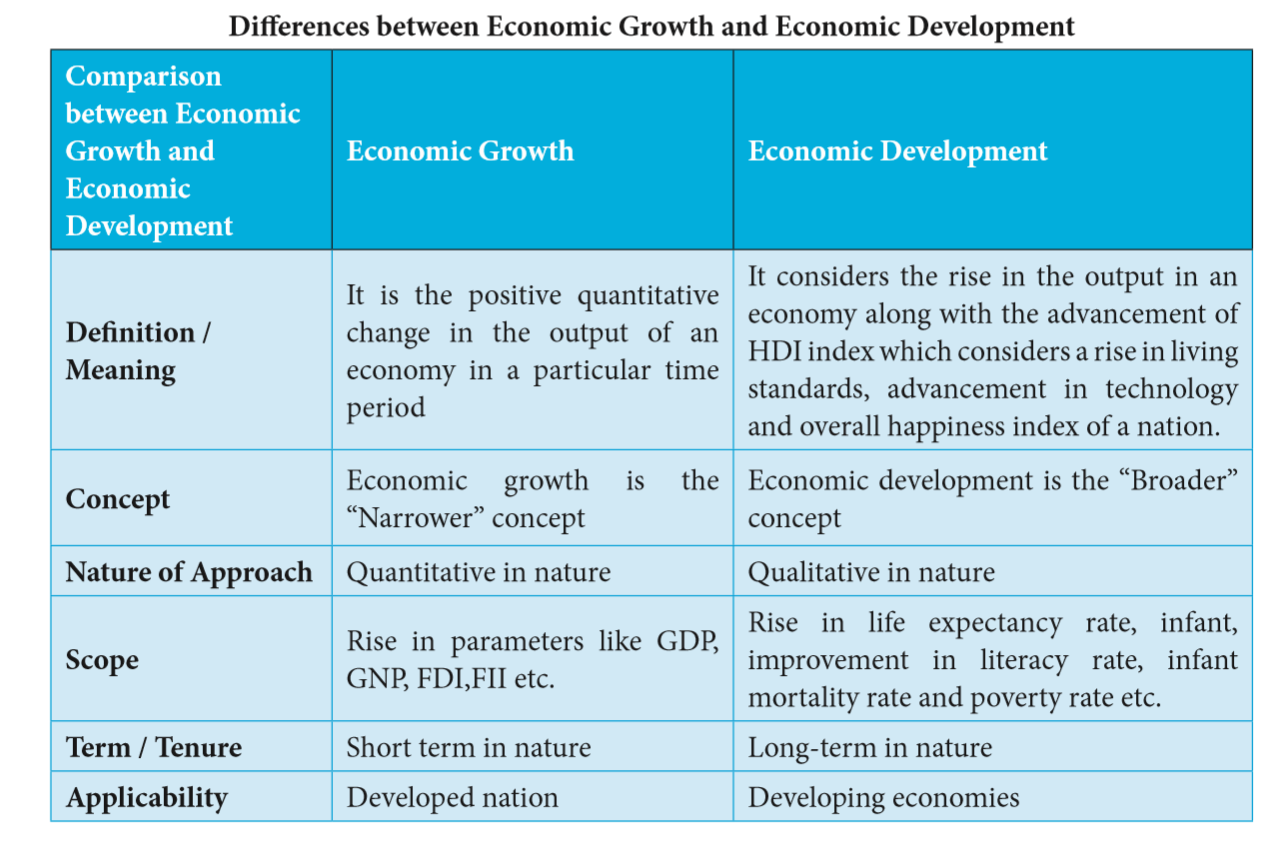
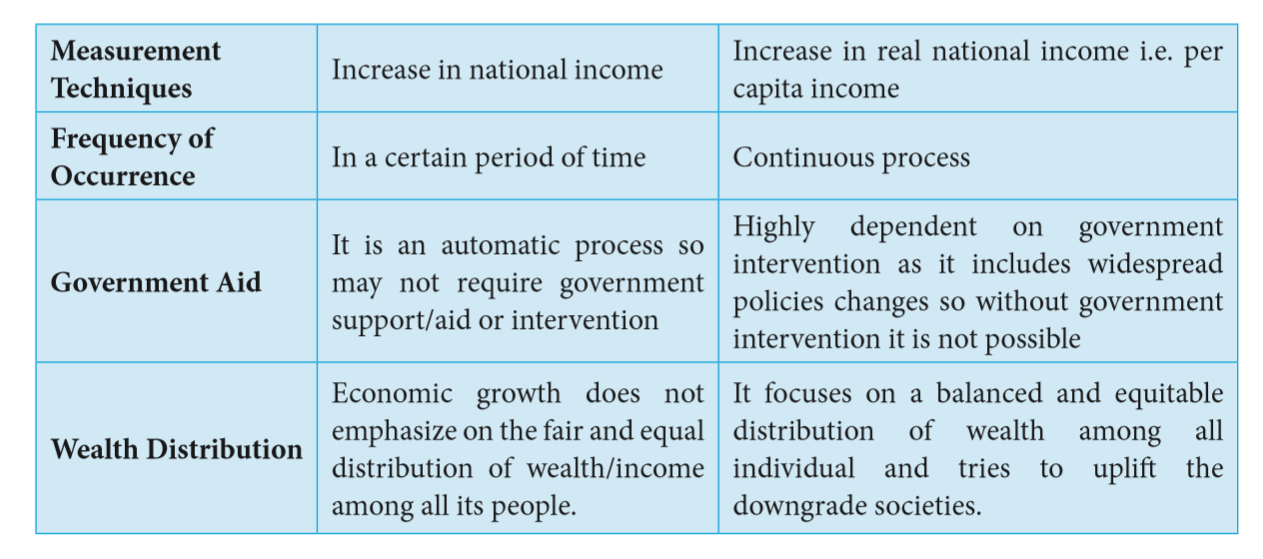
- It is the quantitative measure which considers the rise in the output produced in an economy or nation in a particular period in its monetary value.
- The key parameters of economic growth in any economy are its Gross Domestic Product (GDP) and gross national product which helps in measuring the actual size of an economy.
- For example, we say GDP of India is 2.8 trillion USD and ranked 6th in globe whereas GDP of the United States of America is 19.3 trillion USD and ranked one.
- It shows how much the production of goods and services has increased compared from last year in a quantitative manner. It has many parameters to measure and few of them are human Resources.
- They are Natural Resource, Advancement in technology, Capital formation, Political and social economic factors.
Economic Development
- Economic development projects a broader picture of an economy which takes into account an increase in production level or output of an economy along with an improvement in the living standard of its citizens.
- It focuses more on socioeconomic factors rather than the just quantitative increase in production.
- Economic development is a qualitative measure which measures improvement in technology, labour reforms, rising living standards, broader institutional changes in an economy.
- Human development Index (HDI) is apt tool to measure the real development in an economy.
Developmental Path based on GDP and Employment
- In the development path of India, it first undertook the policy of closed trade. This was to give a thrust to domestic industries and reduce dependence on foreign products and companies.
- Trade and interaction with the outside world remained limited. This outlook continued till 1991 when India finally decided to open its borders to free trade and liberalized its economy by allowing foreign companies to enter the Indian economy.
- A thrust was given to employment generation under the Five Year plans. This was to make up for a rising population and lacking jobs to absorb the increased workforce size.
- Rural development was also given importance in India, for the important constituent it was of the Indian landscape.
- Poverty alleviation came as a corollary of rural development and a part of the development path of India.
- India inherited a poverty-stricken economy from the British rule, which had destroyed its resource base completely. The public sector was given significant importance, Private companies and industries were subject to strict regulations and standards.
- It was believed that the government was the sole protector of the people and would work towards social welfare.
- India has sustained rapid growth of GDP for most of the last two decades leading to rising per capita incomes and a reduction in absolute poverty.
- Per capita incomes have doubled in 12 years. In Per capita income, placing India just inside the Middle Income Country category. Life expectancy at birth is 65 years and 44% of children under 5 are malnourished.
- The literacy rate for the population aged 15 years and above is only 63% compared to a 71% figure for lower middle income countries.
- India has followed a different path of development from many other countries. India went more quickly from agriculture to services that tend to be less tightly regulated than heavy industry.
- There are some emerging manufacturing giants in the Indian economy.
Factors supporting Indian development
- A fast-growing population of working age. There are 700 million Indians under the age of 35 and the demographics look good for Indian growth in the next twenty years at least.
- India is experiencing demographic transition that has increased the share of the working-age population from 58 percent to 64 percent over the last two decades.
- India has a strong legal system and many English-language speakers. This has been a key to attracting inward investment from companies such as those specialising in Information Technology.
- Wage costs are low in India and India has made strides in recent years in closing some of the productivity gap between her and other countries at later stages of development.
- India’s economy has successfully developed highly advanced and attractive clusters of businesses in the technology space.
- For example witness the rapid emergence of Bangalore as a hub for global software businesses.
- External economies of scale have deepened their competitive advantages in many related industries.
Growth of GDP and Economic Policies
- Many Economic Policies have been framed by the Government of India since independence for increasing rate of economic growth and economic development.
- The important economic policies are
Agriculture policy
- Agricultural policy is the set of government decisions and actions relating to domestic agriculture and imports of foreign agricultural products.
- Governments usually implement agricultural policies with the goal of achieving a specific outcome in the domestic agricultural product markets.
- Some over arching themes include risk management and adjustment, economic stability, natural resources and environmental sustainability research and development, and market access for domestic commodities.
- Some Agricultural policies are Price policy, land reform policy, Green Revolution, Irrigation policy, Food policy, Agricultural Labour Policy and Co-operative policy.
Industrial Policy
- Industrial development is a very important aspect of any economy.
- It creates employment promotes research and development, leads to modernization and ultimately makes the economy self-sufficient. In fact, industrial development even boosts other sectors of the economy like the agricultural sector (new farming technology) and the service sector.
- It is also closely related to the development of trade. Several industrial policies since 1948, Industrial policy on large scale industries Eg. Textile Industry policy, Sugar Industry policy, Price policy of industrial growth, Small scale industrial policy and Industrial Labour policy.
New Economic Policy
- The economy of India had undergone significant policy shifts in the beginning of the 1990s.
- This new model of economic reforms is commonly known as the LPG or Liberalisation, Privatisation and Globalisation model.
- The primary objective of this model was to make the economy of India the fastest developing economy in the globe with capabilities that help it match up with the biggest economies of the world.
- These economic reforms had influenced the overall economic growth of the country in a significant manner.
Some other policies in India
- Trade Policy
Import and Export policy (International Trade Policy), Domestic Trade Policy.
- Employment policy
- Currency and Banking Policy
- Fiscal and Monetary Policy
- Wage Policy
- Population Policy
GDP Growth of India
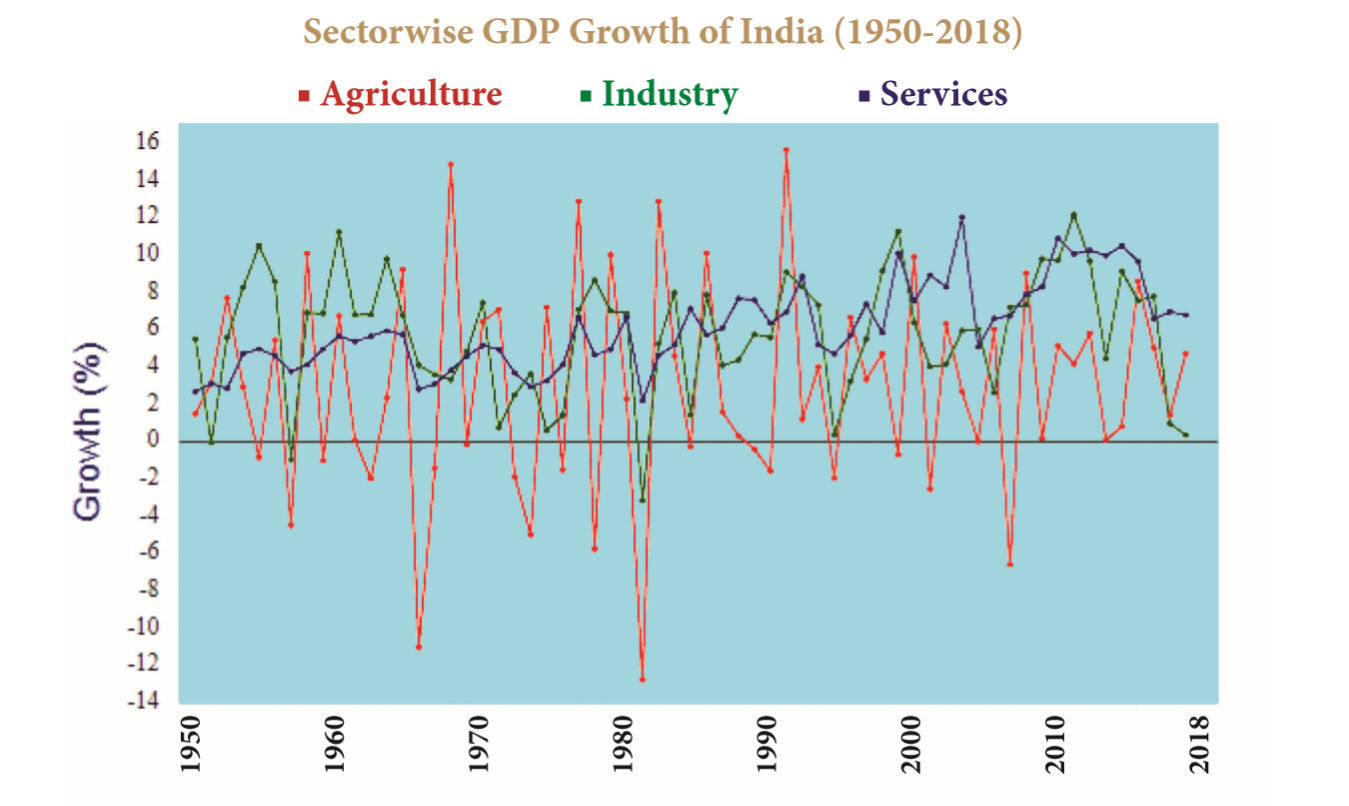
- India’s economic growth story since the 1990s has been steady, stable, diversified, resilent and reflect strong macro economics fundamentals.
- Despite fluctuations in recent quarters due to disruptions caused by two major structural reforms – demonetisation and the Goods and Services Tax (GST).
- The world Bank projected a growth rate of 7.3% in the year 2018-19 and 7.5% 2019-2020.
- India’s average economic growth between 1970 and 1980 has been 4.4% which rise by 1% point to 5.4% between the 1990 and 2000.
- According to IMF World Economic Outlook (October-2018), GDP growth rate of India in 2018 is projected at 7.3% and India is 5th fastest growing nation of the world just behind Bangladesh.
More to Know:
Gross National Happiness (GNH)
- Gross National Happiness (GNH) is a philosophy that guides the government of Bhutan. It includes an index which is used to measure the collective happiness and well-being of a population. Gross National Happiness is instituted as the goal of the government of Bhutan in the Constitution of Bhutan, enacted on 18 July 2008.
- The term Gross National Happiness was coined in 1972 during an interview by a British journalist for the Financial Times at Bombay airport when the then king of Bhutan, Jigme Singye Wangchuck, said “Gross National Happiness is more important than Gross National Product.
- In 2011, The UN General Assembly passed Resolution “Happiness: towards a holistic approach to development” urging member nations to follow the example of Bhutan and measure happiness and well-being and calling happiness a “fundamental human goal.”
- GNH is distinguishable from Gross Domestic Product by valuing collective happiness as the goal of governance, by emphasizing harmony with nature and traditional values as expressed in the 9 domains of happiness and 4 pillars of GNH.
- The four pillars of GNH’s are 1) sustainable and equitable socio-economic development; 2) environmental conservation; 3) preservation and promotion of culture; and 4) good governance.
- The nine domains of GNH are psychological well-being, health, time use, education, cultural diversity and resilience, good governance, community vitality, ecological diversity and resilience, and living standards. Each domain is composed of subjective (survey-based) and objective indicators.
- The domains weigh equally but the indicators within each domain differ by weight.
Human Development Index
- In 1990 Mahbub ul Haq, a Pakistani Economist at the United Nations, introduced the Human Development Index (HDI).
- The HDI is a composite index of life expectancy at birth, adult literacy rate and standard of living measured as a logarithmic function of GDP, adjusted to purchasing power parity.
- India climbed one spot to 130 out of 189 countries in the latest human development rankings released today by the United Nations Development Programme (UNDP).
- India’s HDI value for 2017 is 0.640, which put the country in the medium human development category.
- Between 1990 and 2017, India’s HDI value incased from 0.427 to 0.640, an increase of nearly 50 percent – and an indicator of the country’s remarkable achievement in lifting millions of people out of poverty.
- Between 1990 and 2017, India’s life expectancy at birth too increased by nearly 11 years, with even more significant gains in expected years of schooling.
- Today’s Indian school-age children can expect to stay in school for 4.7 years longer than in 1990. Whereas, India’s GNI per capita increased by a staggering 266.6 % between 1990 and 2017.
Gross value added (GVA)
- Gross value added (GVA) is the measure of the value of goods and services produced in an area, industry or sector of an economy.
- In national accounts GVA is output minus intermediate consumption; it is a balancing item of the national accounts’ production account.
- GVA is linked as a measurement to Gross Domestic Product (GDP), as both are measures of output.
- The relationship is defined as GVA + taxes on products – subsidies on products = GDP GVA = GDP + subsidies – (direct, sales) taxes.
Estimation of GDP
- The Central Statistical Organisation (CSO), under the Ministry of Statistical department keeps the records.
- It’s processes involves conducting an annual survey of industries and compilation of various indexes like the Index of Industrial Production (IIP) Consumer Price Index (CPI) etc.
The modern concept of GDP was first developed by Simon Kuznets for a US Congress report in 1934.
In 1867-68 for the first time Dadabhai Navroji had ascertained the Per Capital Income in his book “Poverty and UnBritish Rule of India”.